๐Ÿ”Œ Connects via WebSocket to ttTrader Core
The ttTrader core runs natively on Windows and Linux. The dashboard is a web application โ€” connect from any OS. โ€” the built-in WebSocket server in the ttTrader core (managerWebSocket_c). On connect it receives a full state snapshot, then incremental updates every 200ms. Order and fill events are pushed immediately. Built with React 18, TypeScript 5, Recharts for charting, Tailwind CSS, and Vite for builds. Zero additional server infrastructure required.
6
Trading Pages
50+
React Components
200ms
Update Cadence

Core Shell

๐Ÿ“ถ

Connection Banner

Sticky top bar with live feed state, latency, quote freshness, reconnect counters, sequence-gap diagnostics, and parsing/runtime telemetry. Always visible โ€” you always know the health of your data feed.

๐Ÿท๏ธ

Sticky Header

Branded header with rotating account stats (equity, margin, P&L) and an execution-mode badge showing PRODUCTION, SIMULATION, or PLAYBACK. Mode-aware โ€” the UI adapts to the backend state.

๐Ÿ”—

URL-Synced State

Workspace persisted in the URL query string: ?page=runtime&scope=2&symbol=BTC::Bitfinex. Deep-link directly into any page, algo scope, or symbol. Browser back/forward navigates your trading workspace.

โŒจ๏ธ

Keyboard-First Navigation

Key Action
1โ€“6 Switch between the six trading pages
J / K Cycle focused symbol up / down
[ / ] Cycle algo scope
G Clear algo scope (view all)
R Send reduce-only
C Cancel all orders
F Flatten all positions
โš ๏ธ

Offline & Degraded Handling

Auto-reconnect with exponential backoff across candidate URLs. Stale-feed watchdog triggers reconnect after 45s of silence. Short disconnect (<60s): positions/orders preserved, stale surfaces clearly marked. Long disconnect (โ‰ฅ60s): full state reset โ€” fresh snapshot on reconnect. Sequence-gap detection triggers immediate reconnect on message loss.

๐Ÿ“‹
Page 1

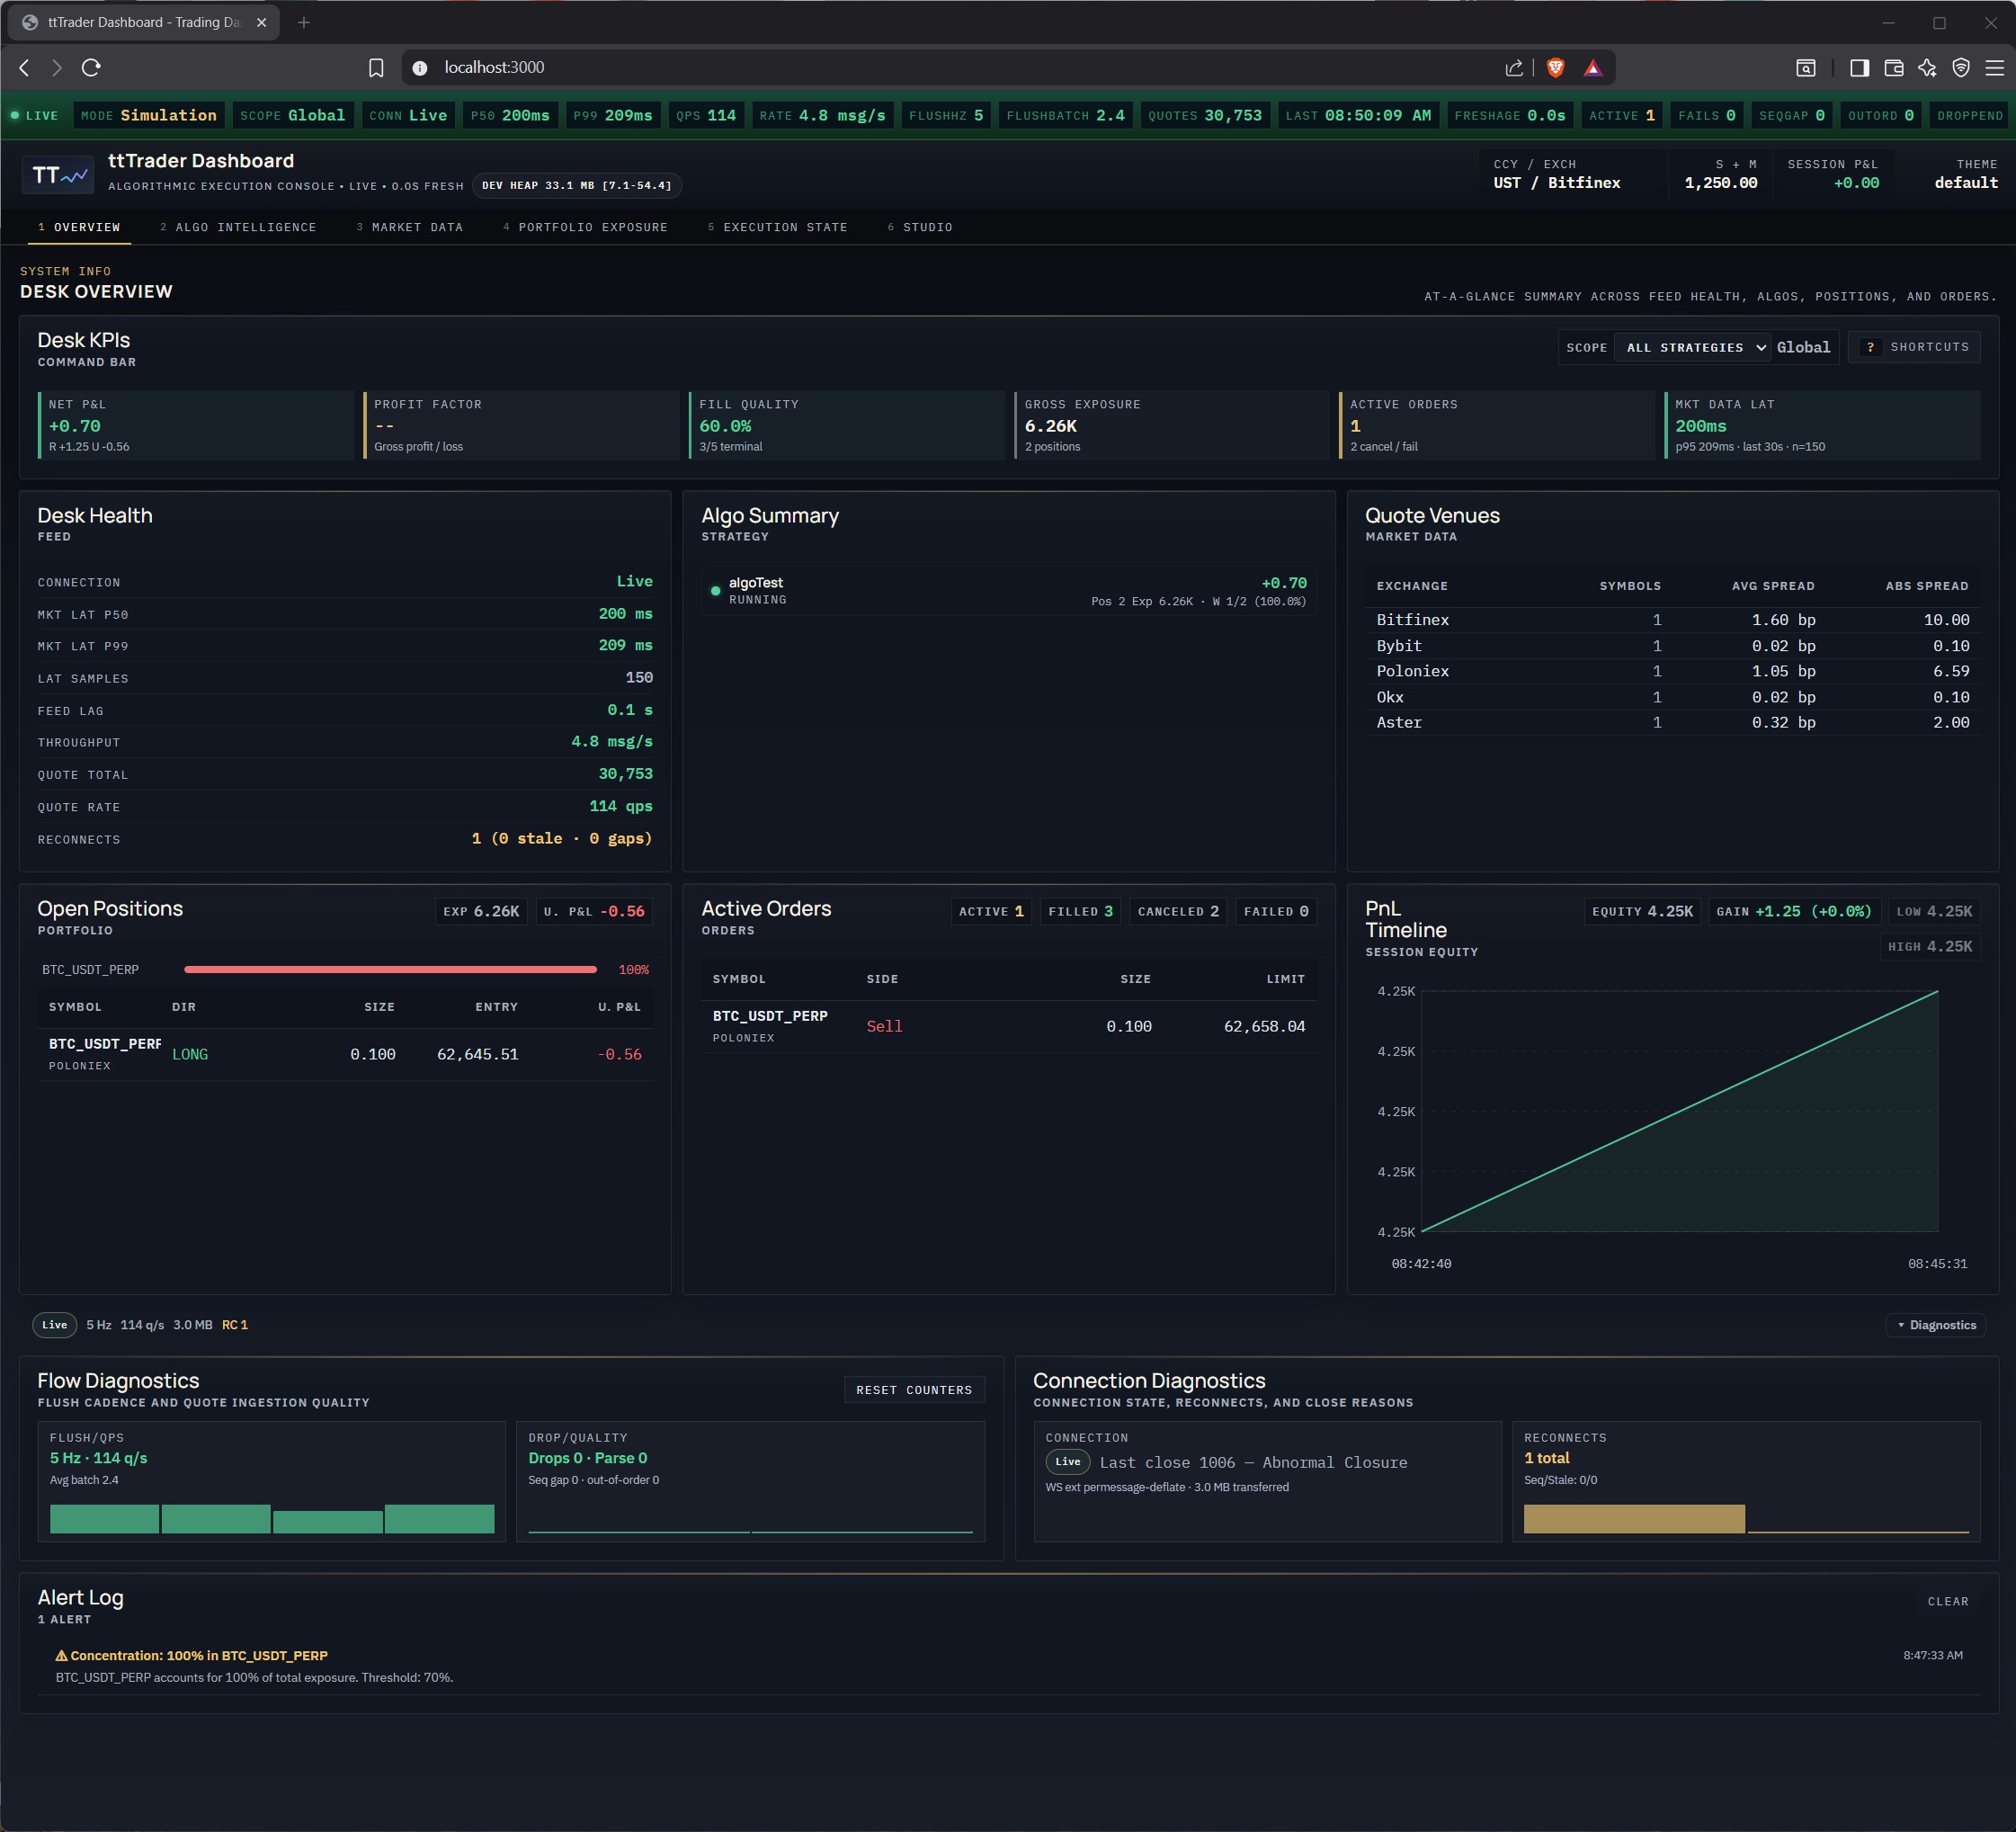
Overview โ€” Desk Command Center

The landing page. At-a-glance health of your entire trading operation.
๐ŸŽ›๏ธ

Desk Command Bar

Scope selector (filter by algo) and KPI strip showing aggregate metrics across all strategies. One-click to drill into any algo.

๐Ÿ“ก

Feed Health Panel

Per-exchange connection status for Market Data, Account, and Trading streams. Stream states: connected (3), connecting (1), disconnected (0), N/A (โˆ’1). Unused streams excluded from health calculation.

๐Ÿค–

Algo Summary Card

All loaded algos with status: RUNNING, STOPPED, HALTED, or REDUCE_ONLY. Start time, status message, and quick-scope link per algo.

๐Ÿ“Š

Quote Venue Summary

Active instruments grouped by exchange. Quote freshness and instrument count per venue.

๐Ÿ“ˆ

Open Positions & Orders

Aggregate position count, total exposure, and active order count. Red/amber/green status indicators.

๐Ÿ”ง

Runtime Diagnostics

Reconnect counters, flush cadence (200ms timer health), sequence gaps detected, parse errors, pending-drop counters. Deep visibility into the data pipeline.
๐Ÿง 
Page 2

Algo Intelligence โ€” Strategy Analytics

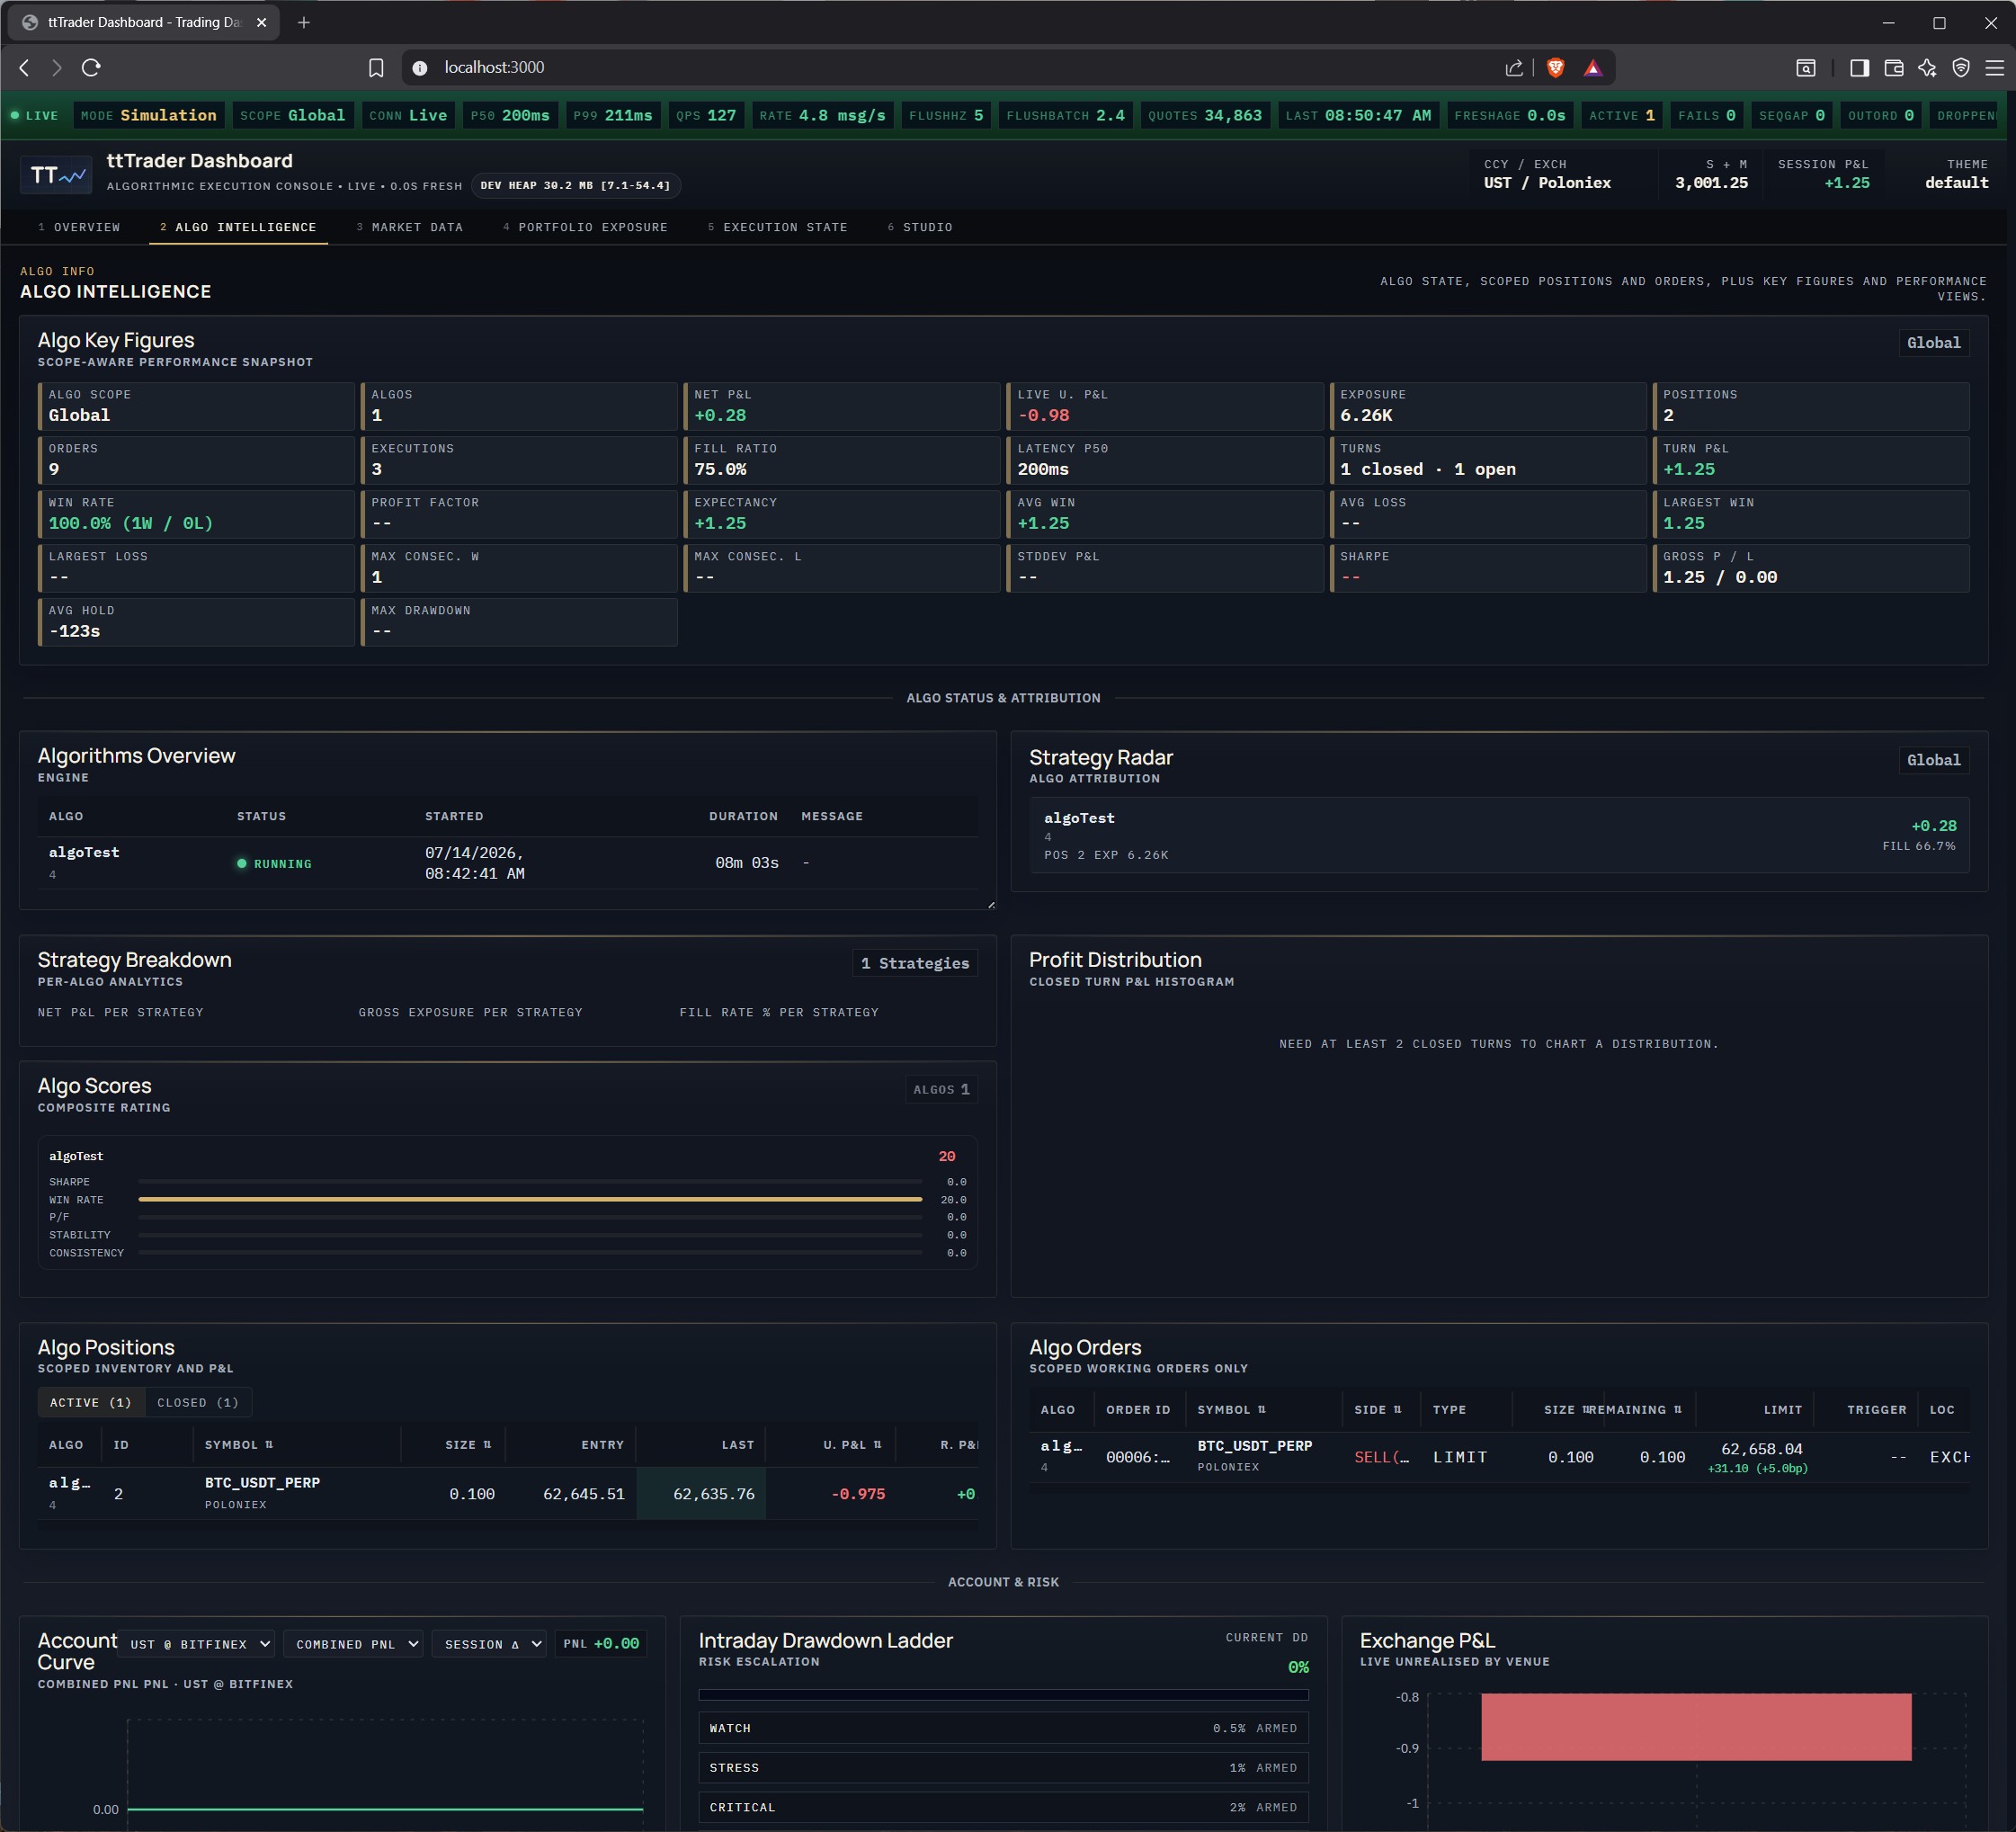
Everything about your running strategies โ€” KPIs, status, positions, orders, and P&L curves.

๐Ÿ“Š

Scope-Aware KPI Grid

Key metrics aggregated per algo: win rate, total P&L, Sharpe estimate, trade count, average hold time. Filter by scope โ€” view all algos or drill into one.

๐Ÿ“‹

Algo Status Panel

Full lifecycle state per algo with transitions: STOPPED โ†’ RUNNING โ†’ HALTED. Visual indicators for running, stopped, halted, and undefined states.

๐ŸŽฏ

Strategy Radar

Per-algo attribution list with quick scoping. Click any algo to scope the entire dashboard to that strategy. See exactly which algo is driving P&L.

๐Ÿ“ˆ

Algo Breakdown Chart

Visual stacked or grouped chart showing contribution per algo to total P&L, exposure, or trade count. Identify top and bottom performers instantly.

๐Ÿ’น

Account Value Curve

Time-series equity curve with per-currency breakdown. Session mode (absolute) and Delta mode (PnL). What-if projection line showing equity if all positions were closed now. Dynamic fill gradient: green above zero, red below.

๐Ÿ“‹

Scoped Positions Table

All positions filtered by current scope. Instrument, direction, size, entry price, mark price, unrealized P&L, fees. Instrument-aware precision formatting.

๐Ÿ“

Scoped Orders Table

Active orders filtered by scope. Order ID, instrument, side, type, limit, size/size-left, state, timestamps. Quick status at a glance.

๐Ÿ“ˆ
Page 3

Market Data โ€” Real-Time Analysis

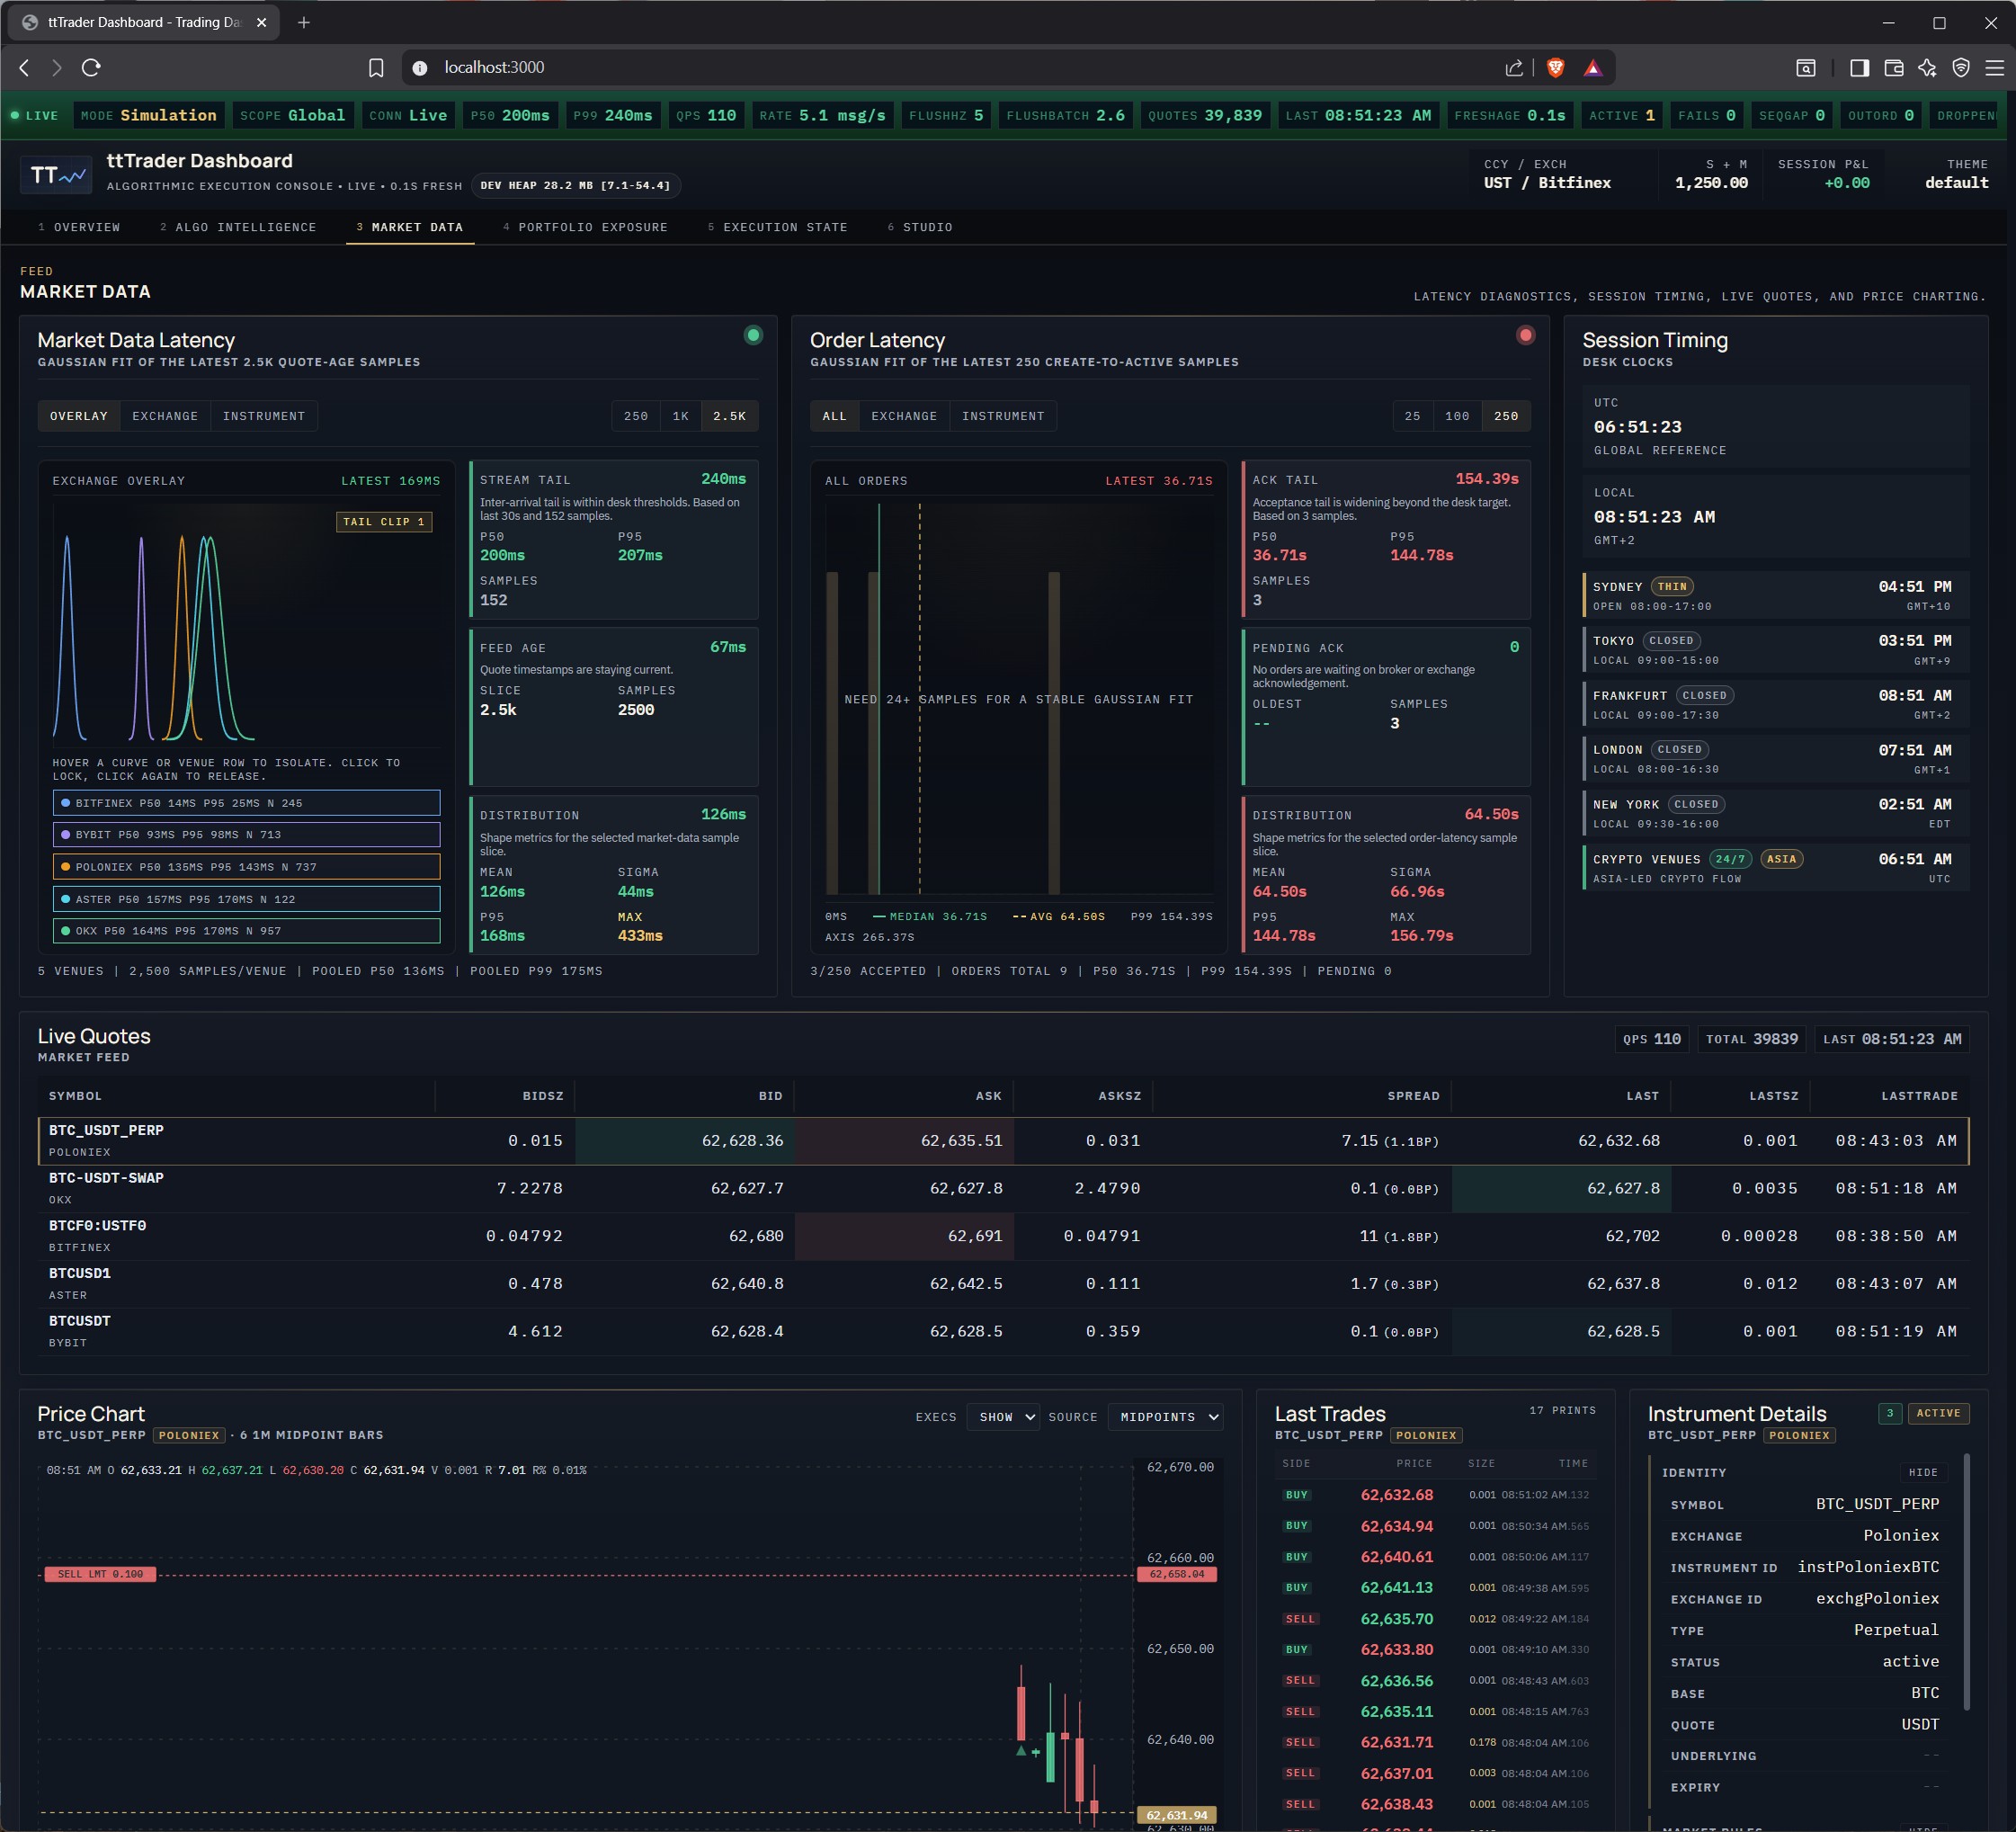
Live market data visualization with latency analysis, price charts, and trade tape.

โฑ๏ธ

Feed Latency Histogram

Distribution of exchange-to-dashboard latency with p50, p95, p99 percentiles. Sliceable by exchange and instrument. Live-updating histogram with 2500 retained samples per key.

๐Ÿ“จ

Order Latency Histogram

Acknowledgement timing distribution โ€” time from order submission to exchange confirmation. Identify venue-specific latency characteristics.

๐Ÿ“–

Quotes Panel

Scrollable instrument list with live bid/ask/spread. Click any instrument to set the active focus โ€” the chart, trade tape, and detail panels all switch to that symbol. Sort by symbol, exchange, spread.

๐Ÿ•

Global Market Session Clock

Visual clock showing current UTC time with major market session overlaps (Asia, Europe, US). Helps contextualize volume and volatility patterns.

Price Chart

The centerpiece of market analysis. Multiple candle sources:

๐Ÿ•ฏ๏ธ
Trade Candles
1-minute OHLC built from tick data โ€” 120 candles retained per instrument
๐Ÿ“Š
Midpoint Candles
1-minute candles from BBO midpoint โ€” smoother, less noisy
๐ŸŽฏ
Execution Markers
Your fills plotted directly on the chart at exact price and time
๐Ÿ“Œ
Position Entry Lines
Horizontal reference lines at your average entry price
๐Ÿ“
Working Order Lines
Limit/stop order levels shown as reference lines
Chart Data Sources:
marketDataByInstrument["BTC::Bitfinex"]
  โ”œโ”€ tradeCandles[0..119]
  โ”œโ”€ midpointCandles[0..119]
  โ”œโ”€ tradeHistory[0..63]
  โ””โ”€ instrument (precision)

Overlays:
  โ”œโ”€ Execution markers
  โ”œโ”€ Position entry lines
  โ””โ”€ Working order lines
๐Ÿ“œ

Instrument Trade Tape

Real-time trade-by-trade feed for the focused instrument. Price, size, aggressor side (buy/sell), timestamp. Last 64 trades retained. Color-coded: green for buyer aggressor, red for seller.

โ„น๏ธ

Instrument Details Card

Full metadata for the focused instrument: base/quote currency, price step, size step, min/max order size, contract size, maker/taker fees, leverage limits, instrument type.

๐Ÿ“Š
Page 4

Portfolio Exposure โ€” Risk & Concentration

Understand where your capital is deployed and where your risk lies.

๐Ÿ”ฅ

Risk Heatmap

Grid visualization of exposure across instruments and algos. Color intensity scales with position size. Click any cell to focus that symbol โ€” the quotes panel, chart, and details all sync. Hover for exact exposure values.

๐ŸŽฏ

Symbol Focus Workspace

Dedicated workspace for a single instrument: quote context (bid/ask/spread), pressure indicators, recent range, and combined order + execution ledger. Everything about one symbol in one view.

๐Ÿ’ฐ

Account Summary Panel

Per-exchange, per-currency breakdown: spot balance, available margin, used margin, total equity, buying power, session P&L, total P&L. Value delta precision from instrument metadata.

๐Ÿ“‹

Open Positions Table

All positions with instrument-aware precision formatting. Symbol, direction (LONG/SHORT), size, entry price, mark price, unrealized P&L, fees, algo attribution. Sorted and filterable.

๐Ÿ“ˆ

Account Value Curve

Equity time-series with Spot (green) and Margin (gold) area breakdown. Delta mode for session P&L with Spot/Margin/Combined/Overlay source selection. What-if projection line.

๐Ÿชœ

Drawdown Ladder

Ranked drawdown events: peak equity, trough equity, drawdown %, duration, recovery time. Identify worst-case scenarios and recovery patterns at a glance.

โšก
Page 5

Execution State โ€” Order Flow & Risk

Complete order lifecycle visibility โ€” from creation to fill, with emergency risk controls one keystroke away.

๐Ÿ“Š

Order Flow Panel

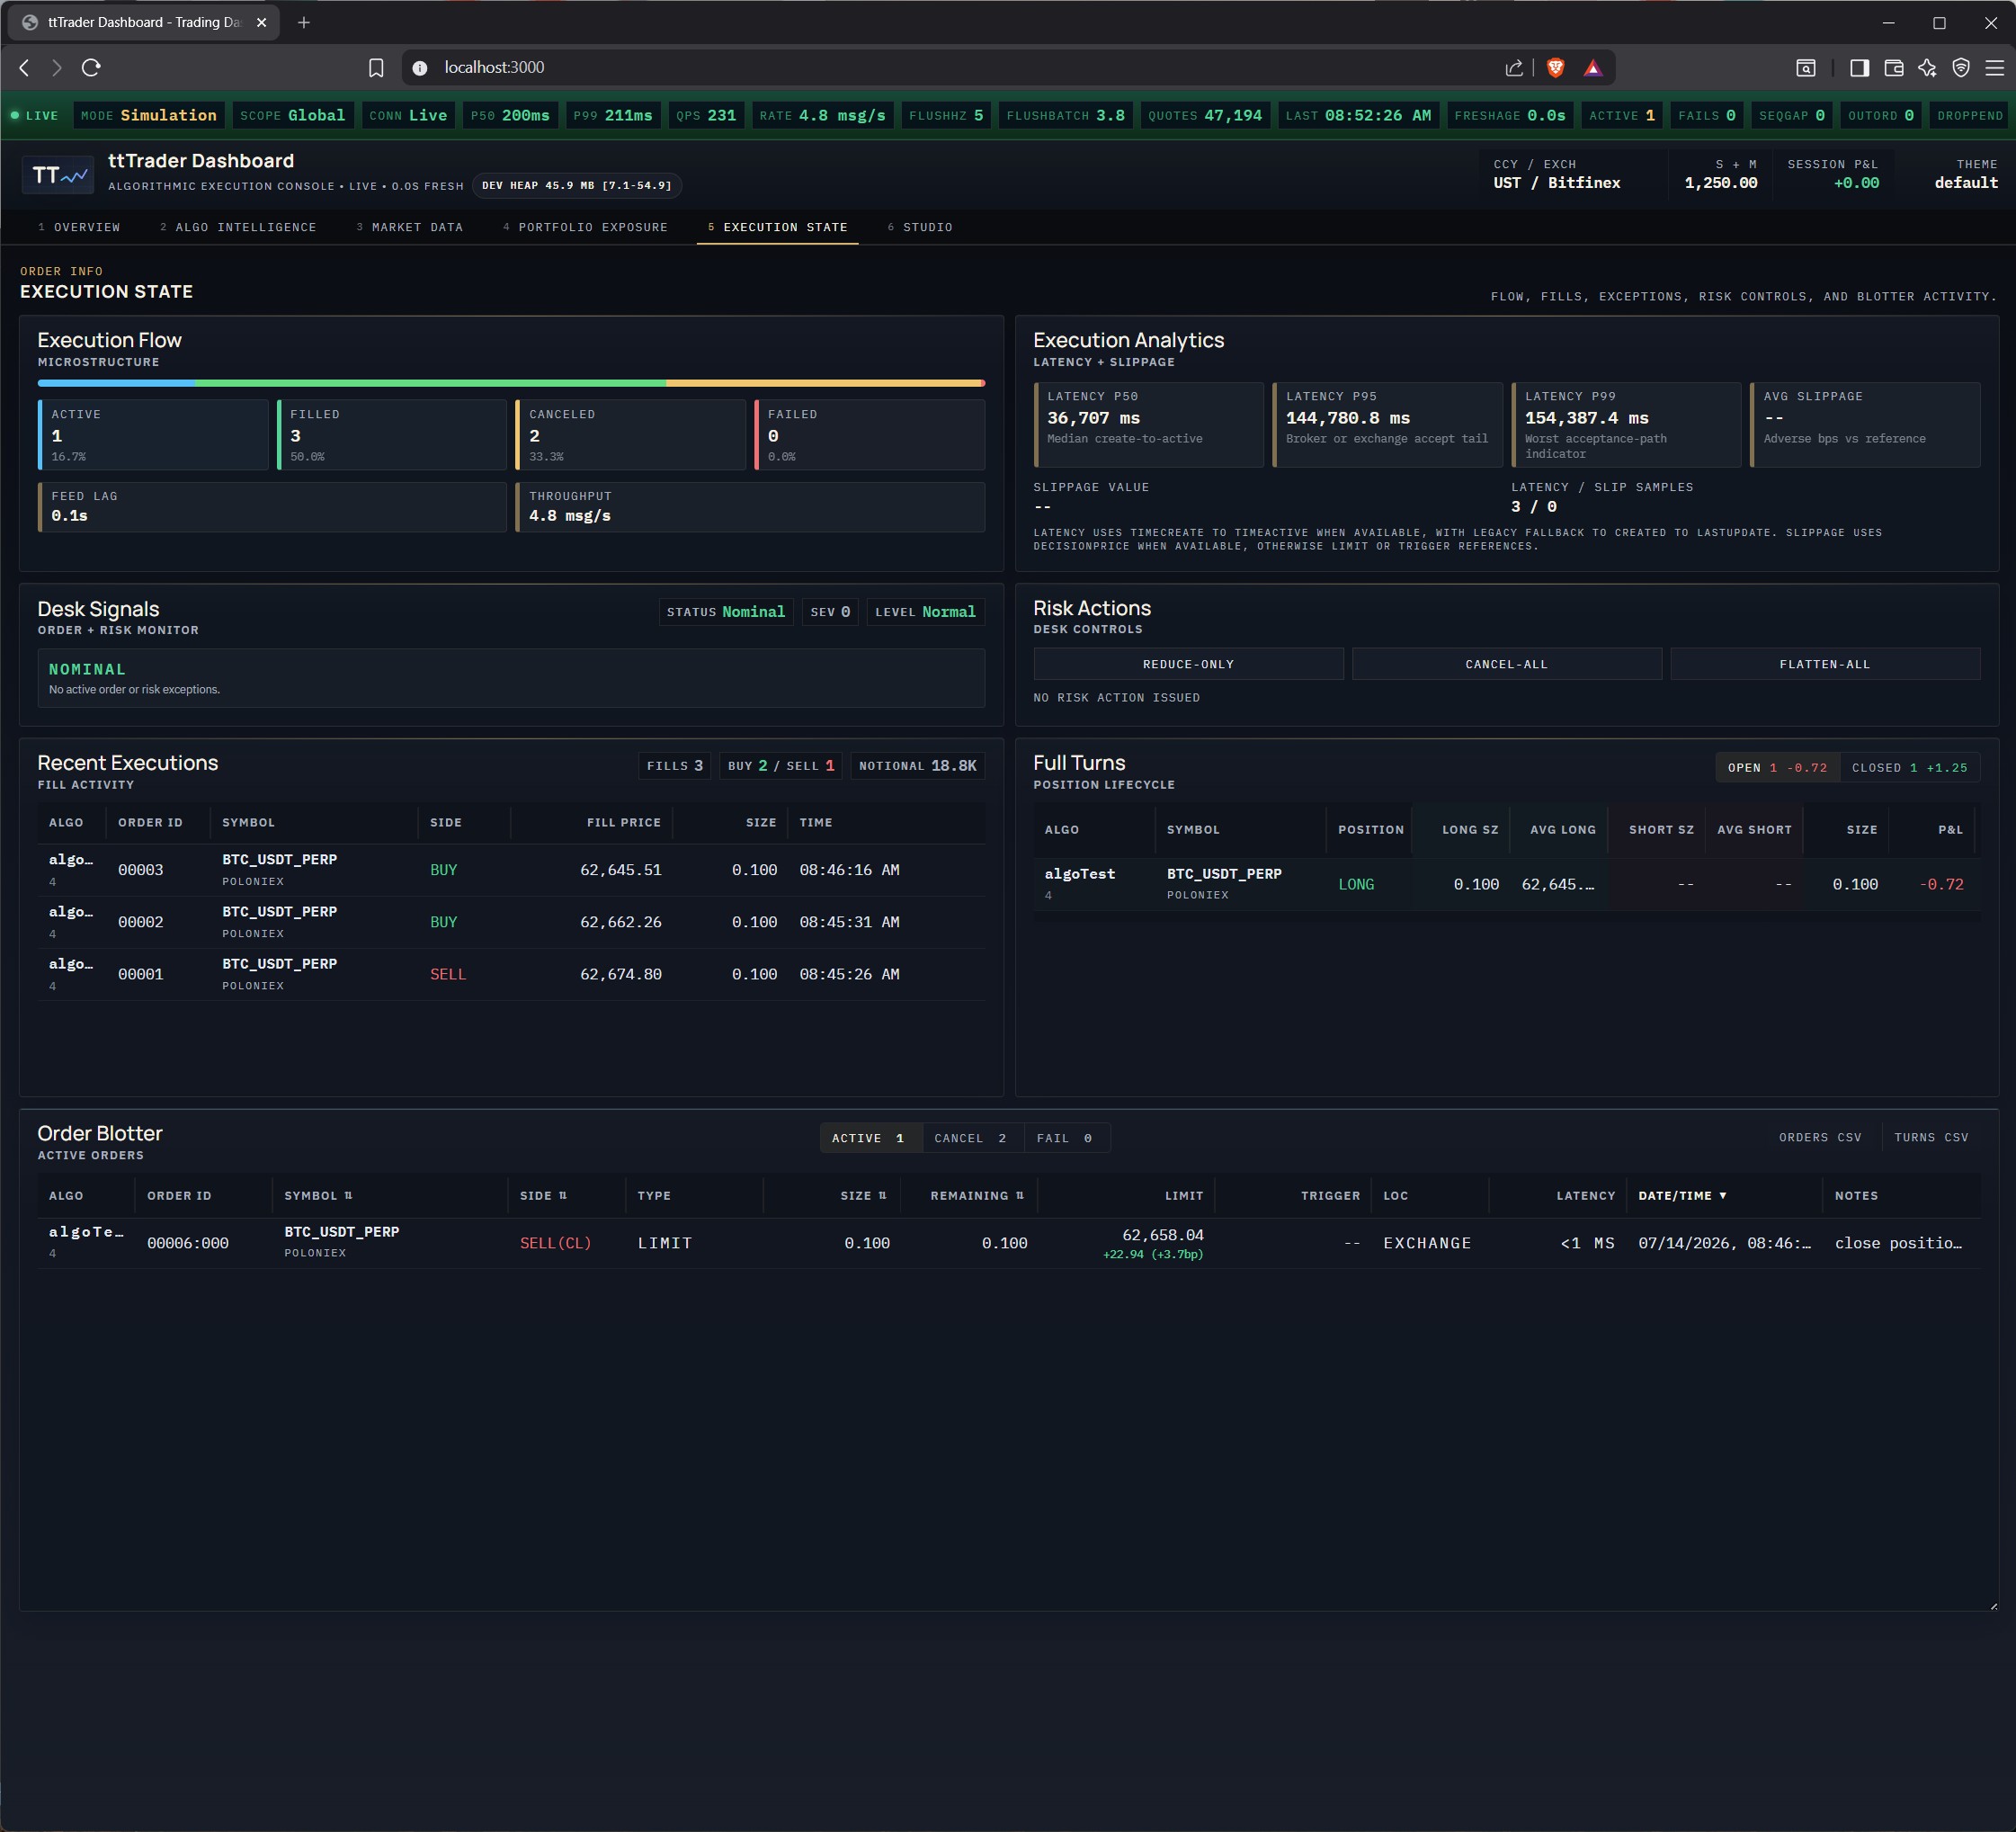
Activity summary: orders created, filled, cancelled, failed โ€” per time window. Throughput metrics and fill rate statistics. Identify execution quality issues before they become problems.

๐Ÿ“ˆ

Execution Analytics

Fill price vs. expected price analysis. Slippage distribution. Fee breakdown by exchange and instrument. Maker vs. taker fill ratio per algo.

โš ๏ธ

Exception Rail

Dedicated alert strip for anomalies: failed orders (with error reasons), drawdown pressure (positions approaching stop levels), risk-action anomalies. Never miss a problem.

๐Ÿ›‘

Risk Action Strip

Three emergency buttons with keyboard shortcuts: Reduce-Only (R) โ€” all algos stop opening new positions. Cancel-All (C) โ€” cancel every open order. Flatten-All (F) โ€” market-close all positions. Each action tracked with request ID, ACK/NACK response, and timeout handling.

โœ…

Recent Executions Panel

Live feed of the most recent fills: instrument, side, size, price, fee, timestamp. Color-coded by direction. 2000 retained executions.

๐Ÿ”„

Full Turns Table

Complete position lifecycle tracking. Each row is a closed turn: algo, instrument, direction, entry/exit price, size, realized P&L, fees, duration. Algo turn metrics: win rate, average win/loss, profit factor.

๐Ÿ“‹

Filterable Order Blotter

Complete order history with tabs: Active, Cancelled, Failed, All. Every order field visible: ID, instrument, side, type, limit, size, filled, state, location, algo, timestamps. 100 retained terminal orders per bucket.

๐ŸŽฌ
Page 6

Studio โ€” Recording & Playback

The Studio page turns your trading desk into a research lab. Record live market data, replay it at any speed, and analyze strategy behavior with frame-by-frame precision โ€” all through the same dashboard.

๐Ÿ”ด

Recording Panel

Start/stop recording of live JSON trading data directly from the backend. Sessions saved as .ttpb files with full event fidelity โ€” orders, fills, positions, quotes, trades, account snapshots, and instrument state. Live status shows event count and file size during recording.

Mode-aware: Recording controls only available in PRODUCTION or SIMULATION mode. Automatically hidden during playback.

โ–ถ๏ธ

Transport Controls

Full playback transport: Play, Pause, Stop, Single-Step Forward. Speed selector: 1ร—, 10ร—, 100ร—. Loop mode for continuous replay. Click-to-seek on the interactive timeline.

Mode-aware: Transport controls only available in PLAYBACK mode.

๐Ÿ“

File Browser

Browse, load, delete, and rename .ttpb files from the server. Each entry displays: file name, size (bytes), date range (start โ†’ end), total event count, and contained instrument symbols. Click to load into the playback engine.

๐Ÿ“Š

Interactive Timeline

Visual scrubber showing playback progress as a filled bar. Current position marker with elapsed time. Click anywhere to seek. Hover for exact position preview. Events processed vs. total events counter.

โ„น๏ธ

Session Info Panel

Active playback session details: current file name, playback state (idle/loaded/playing/paused/complete/error), current speed, progress percentage, elapsed time range, events processed / total events. Recording session details: state, events recorded, current file size.

Data Architecture

๐Ÿ—๏ธ Single Source of Truth
The dashboard uses a canonical instrument map keyed by symbol::exchange. Every component โ€” the quotes panel, price chart, trade tape, positions table, orders table โ€” reads from this single structure. No mixed-snapshot rendering. No fallback chains. Quote + instrument always from the same entry.
WebSocket ServerttTrader Core :18181
โ–ผ 200ms flush ยท Immediate for orders/fills
Quote HandlerPending buffer
Order HandlerImmediate dispatch
Fill HandlerAtomic reports
โ–ผ                 โ–ผ                 โ–ผ
Canonical Store: marketDataByInstrument Map<"SYMBOL::EXCHANGE", {quote, instrument, tradeHistory, tradeCandles, midpointCandles}>
โ–ผ   โ–ผ   โ–ผ   โ–ผ   โ–ผ   โ–ผ
Quotes Panel
Price Chart
Trade Tape
Positions
Orders
Risk Heatmap
๐Ÿ”’

Strict Parser Contract

Every field has exactly one canonical key name. No aliases, no alternative spellings. The strictRecord.ts parser enforces this at runtime: rejects unexpected keys, throws on missing mandatory fields, never silently fabricates defaults. A full codebase audit identified and tracked critical fallback patterns for remediation โ€” no || 0 for missing P&L, no || 'UNKNOWN' for missing exchange names.

๐Ÿ”€

Order Merge Rules

Terminal orders are immutable โ€” FILLED, CANCELED, FAILED, DELETED orders are frozen. Stale snapshots attempting to resurrect terminal orders are silently dropped. Defined-fields-only merge โ€” deltas only update explicitly provided keys. Snapshot-only fields preserved across delta updates. Executions are append-only โ€” each execution is a distinct entry by ID; duplicates throw.

๐Ÿ“

PnL Tracking

โ†’
Position-based PnL
Server-reported with live BBO price overrides for real-time accuracy
โ†’
Turn-based PnL
Calculated from turn records using BBO prices. Per-algo, per-symbol breakdowns
โ†’
Full Turn Lifecycle
Open โ†’ Addition (avg price update) โ†’ Reduction โ†’ Close (with timeClose). Direction flips close current turn + open new.
๐Ÿ’พ

Data Retention

Data Retention
Trade history per instrument 64 prints
Trade candles 120 ร— 1-min candles
Midpoint candles 120 ร— 1-min candles
Quote statistics keys 3000 (target 2500)
Feed latency samples 2500 per key
Account history 180 points
Terminal orders 100 per bucket
Executions 2000